Table of contents
Getting Started with Report Builder
Tuesday May 14, 2024-14 min readIntroduction
Reports are essential in business for conveying information, problem-solving, and recommending actions. But tailoring them to specific needs isn’t always easy. With the Report Builder app, you can effortlessly create custom reports from your Appward data. Select from pre-designed templates or craft your layout effortlessly using drag-and-drop functionality, enhanced with scripting capabilities.
Let’s get started
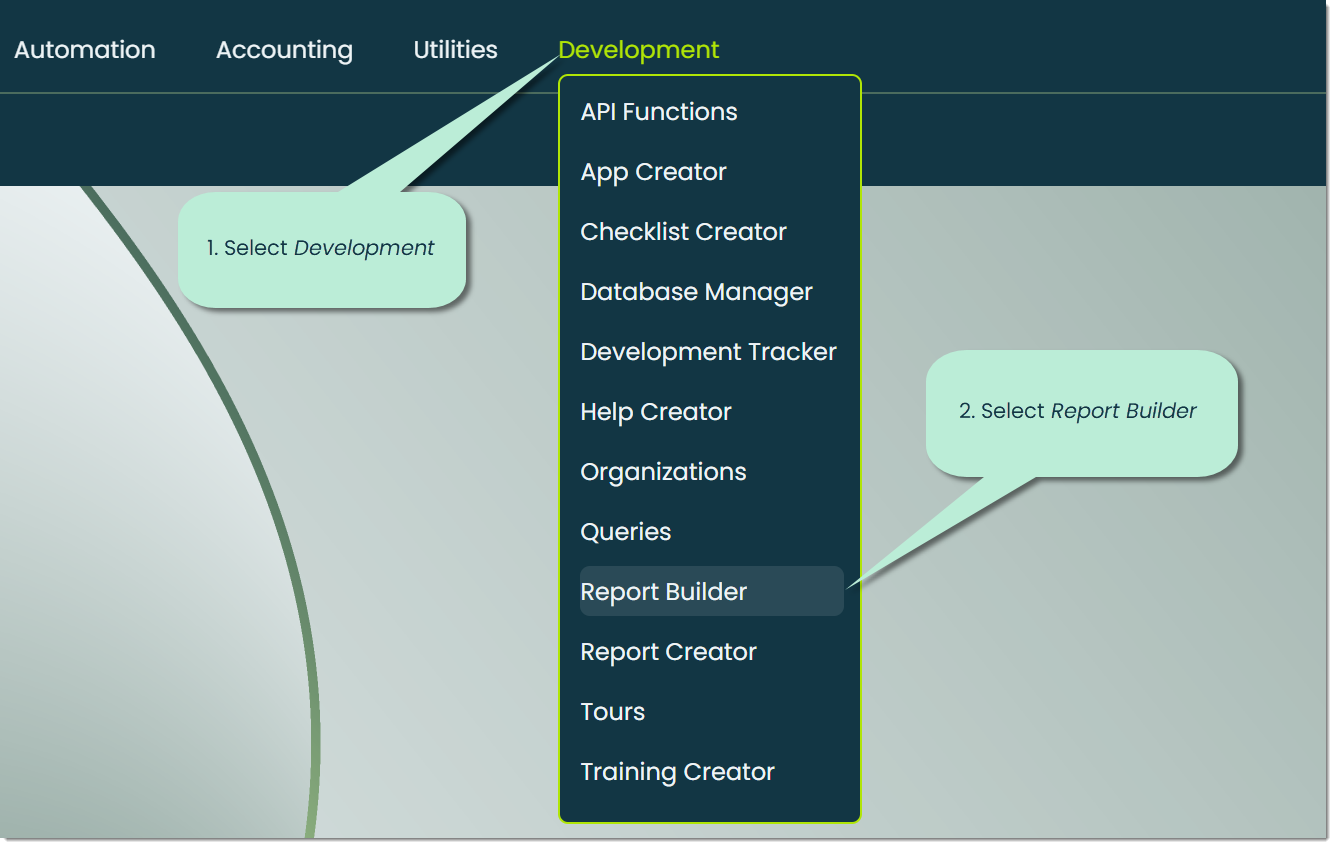
To open the Report Builder app, go to the Development tab at the top of the screen and select Report Builder from the drop-down menu.
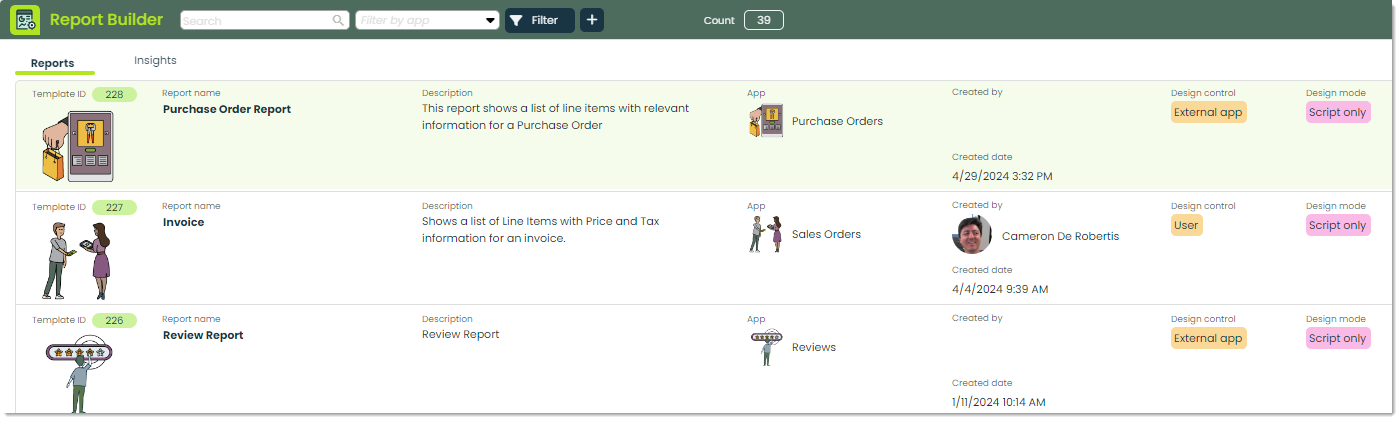
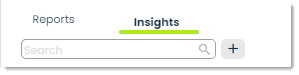
When you first open the app, you’ll find a list of reports created by members of your organization.
The second tab you’ll see is the Insights tab. Insights bring your organization’s data to life. You can create customized views for any topic, keeping track of the information that matters most. For more on Insights, please check out our Getting Started with Insights guide.
How to create a report
To add a new report, click the + icon at the top of the app screen.
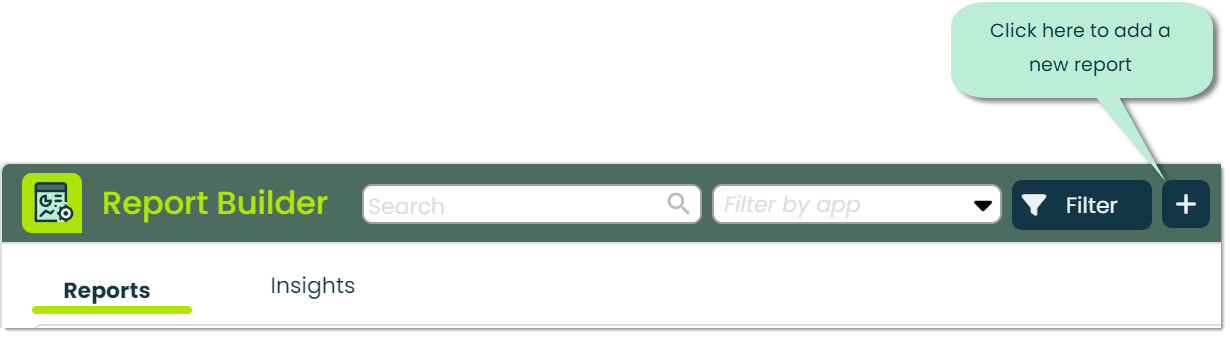
Next, you’ll be shown the Add Report Template popup, where you can begin to input the core details of the report you are building. Let’s go over the available fields.
The first thing you’ll do when creating a report is to select whether you want to design the report in app, or design the report using a customized script.
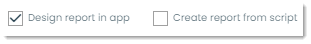
Design report in app: Designing a report within the report builder app offers you the flexibility to define all report details directly within the application interface. This eliminates the need for importing external resources, such as custom coded scripts or files.
Create report from script: Alternatively, you have the option to create a report by importing an external script, providing further customization and functionality to your report-building process.
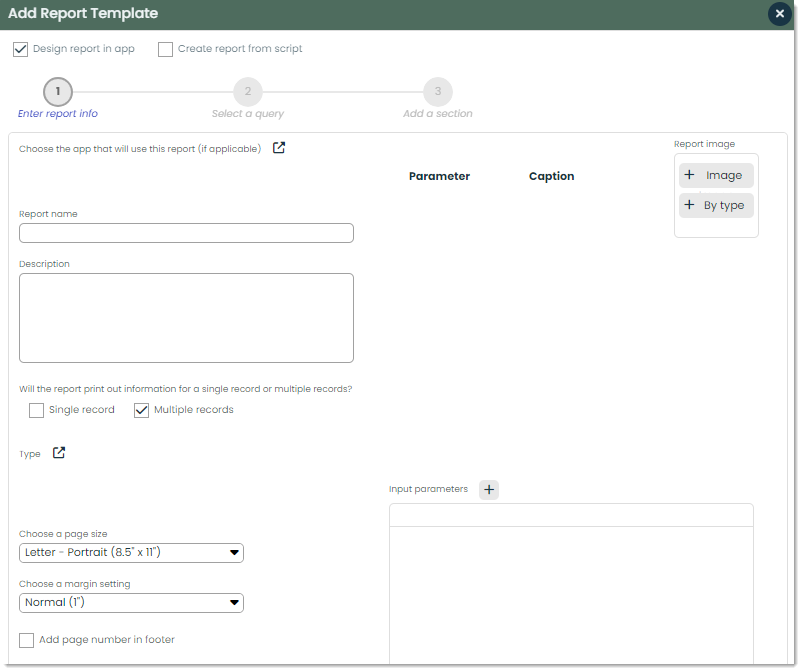
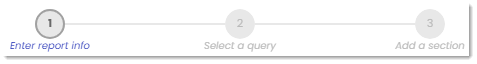
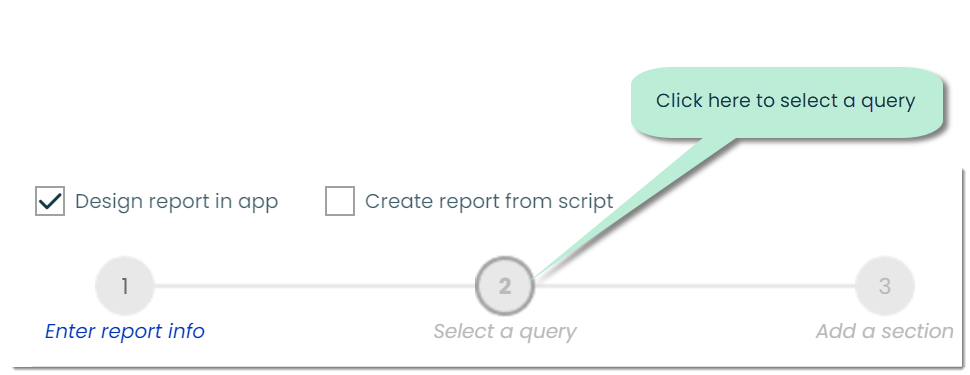
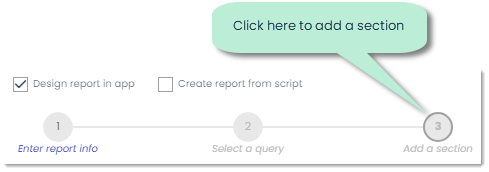
Creation steps – At the top of the Add Report Template popup, you’ll see a chevron bar indicating what step of the creation process you are in.
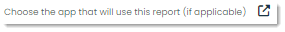
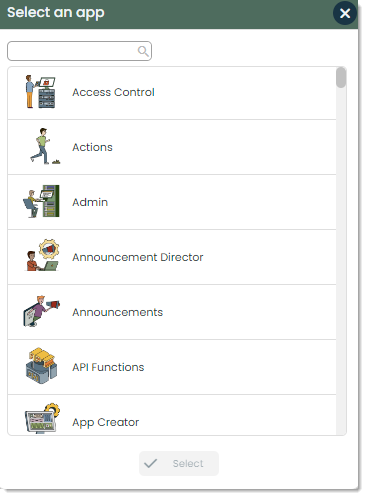
Choose the app that will use this report(If applicable) – Here, you can click on the external link icon to access a list of available apps. From this list, you can select the specific app where you intend to use this checklist.
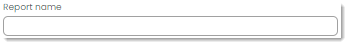
Report name – The Report name will be the title of your report. You can name this anything you want.
Description – In Decription, provide a short summary of what a reader can expect to find in your report.
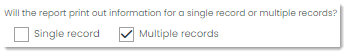
Single or multiple records – In this field, you can decide if your report will be printing out results for a single record or for multiple records.
Type – You can categorize the report you create by the type you assign to it. Visually, types are labels with custom names, colors, and images that can be assigned to records throughout Appward. However, types provide you with a way to organize your data in a fully flexible, customized way that suits your business.

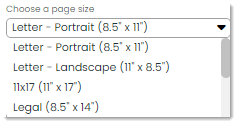
Choose a page size – In the Choose a page size dropdown menu, you can specify what the size of the pages of your report will be. As an example, you can use Letter – Portrait(8.5′ x 11″) for a standard page.
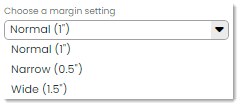
Choose a margin setting – In addition to selecting a page size, you can also select the margin setting for your page. The three options available are Normal(1″), Narrow(0.5″), and Wide(1.5″).
Add page number in footer – You can help readers identify the page they are reading by adding a page number in the footer of the report.
Input Parameters – With input parameters, you can enable users to input valid values before retrieving the results, enhancing customization and relevance of your reports.
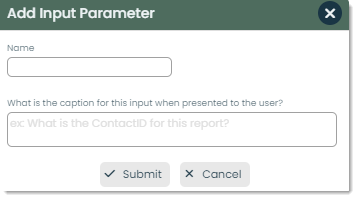
Pressing the add button will bring up this popup, where you can define the name of the parameter and the caption presented to the user.
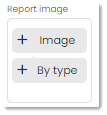
Report image – Report image is where you can assign an image to the report record. You can select any image you like, or use the existing type image.
Selecting a query – Your report can include custom queries using your organization’s data tables.
Add a section – This is where you can add a new section to the report. Sections help you organize content logically, allowing for clearer presentation and easier navigation within the report.
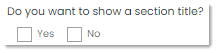
Section title – Specify a section title for the section you add. You can enable or disable this.
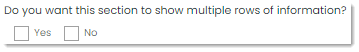
Display multiple rows – Specify if the section you are adding will require multiple rows.
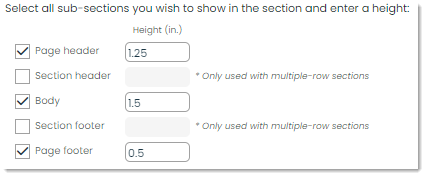
Sub sections – Here, you can decide if you want to include any sub sections within the sections you added. Additionally, you can define the height of these sub sections.
Viewing and designing a report
To view and manage the details of a report , click on the corresponding row of the record you wish to access.
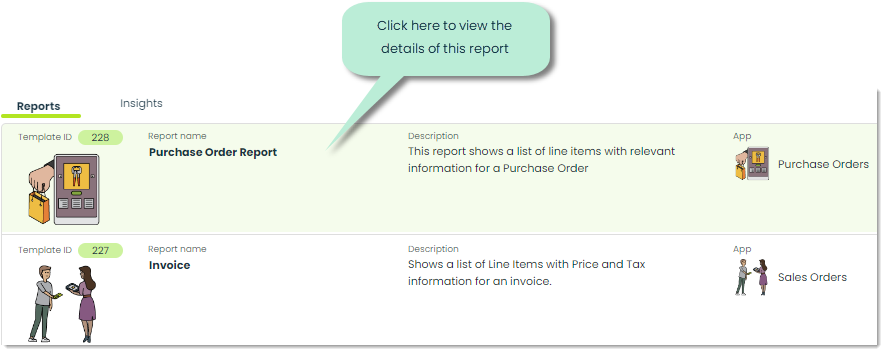
After selecting a report to view, you’ll be taken directly to the record’s front line. Here, you’ll see all the necessary details of the report. Let’s take a look at the various fields displayed here.
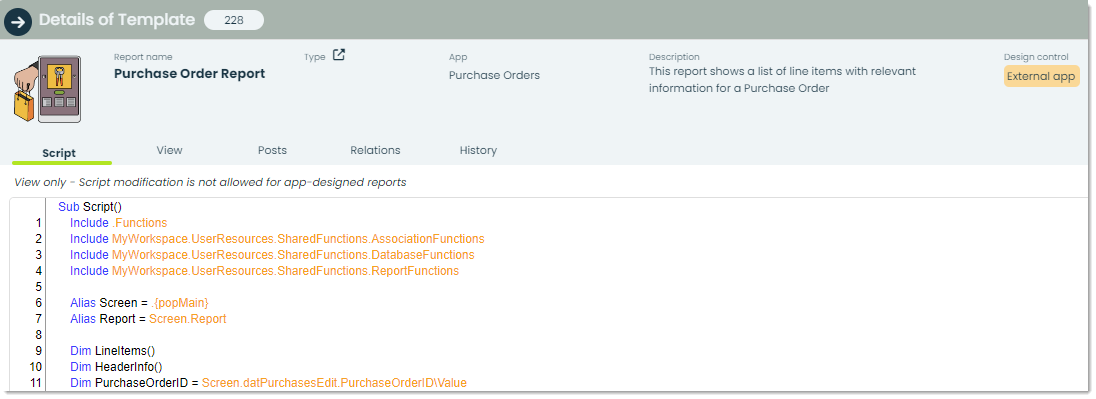
Script – The Script tab provides direct access to the backend process of report generation. It displays the script uploaded during report creation or, if not uploaded, the script automatically generated by the app.
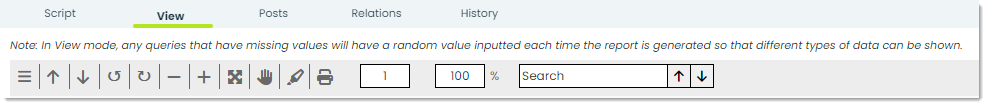
View – In the View tab, you can view a preview of the report you created.
Also, if your report uses the “Blocks” design mode, you can customize it completely with a simple drag-and-drop editor. An additional Design tab will be available alongside the Script tab. Let’s go over an example of what you could expect to see here.
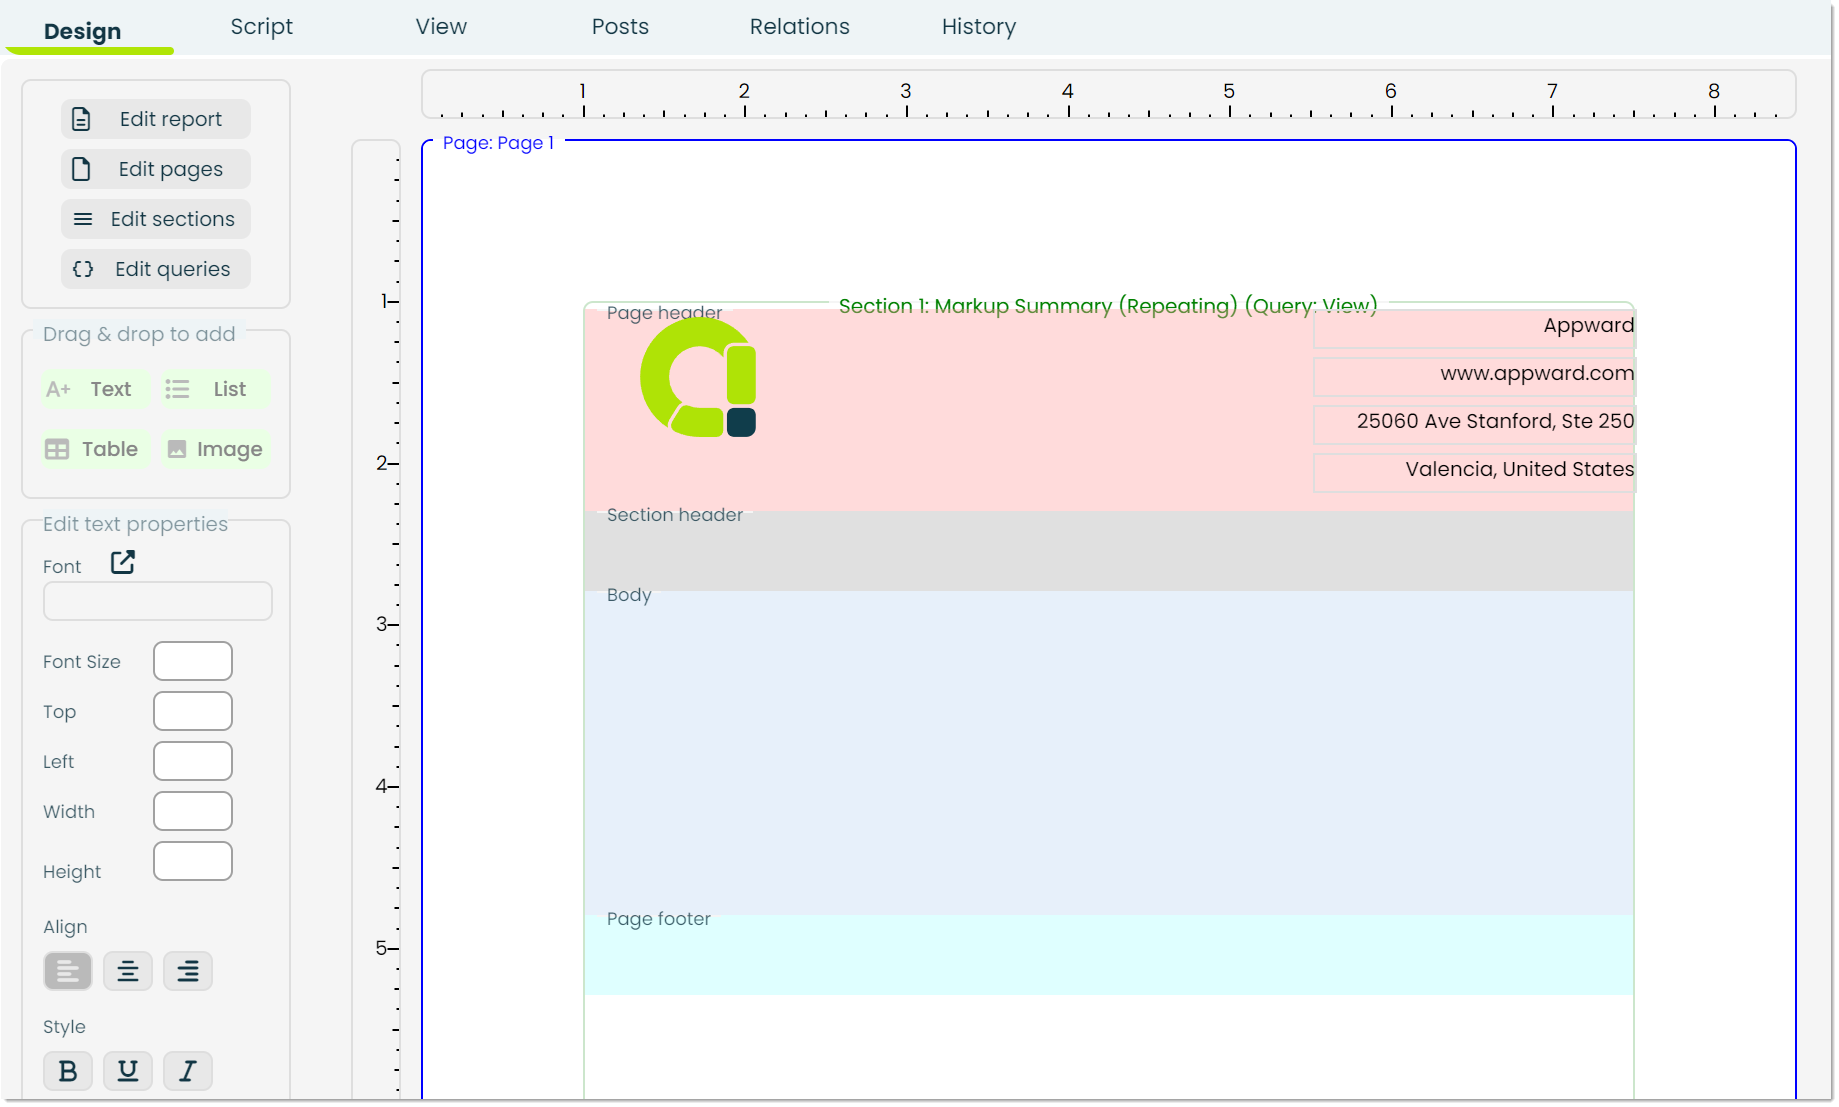
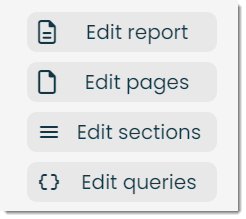
Edit buttons – You can edit various parts of the report by utilizing the following buttons.
Edit report: Allows modification of the entire report structure.
Edit pages: Edit individual pages found in the report.
Edit sections: Adjust specific sections within a page.
Edit queries: Modify database queries that are used to fetch data for the report.
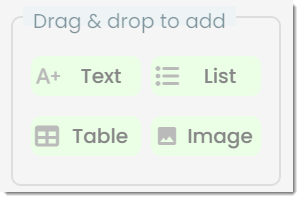
Drag & drop to add – In the Drag & drop to add feature, you can intuitively drag various objects within the report to customize its layout effortlessly.
Text: Traditional text box.
List: A sequential list.
Table: A table with dimensions specified by you.
Image: Images directly select from your personal device or the Appward cloud.
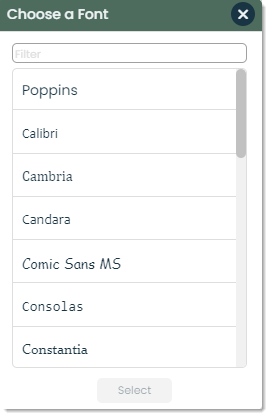
Font – Here, you can specify the specific font that will be used in the report.
By clicking on the external link icon, you’ll bring up a list of available fonts that you can choose from. The default for most things in Appward is Poppins.
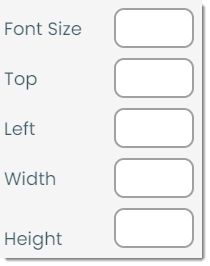
Font settings – Font settings is where you can define specific features of the font you previously selected.
Font size: The size of the font.
Top: The vertical position of the element.
Left: The horizontal position of the element.
Width: The width of the element.
Height: The height of the element.
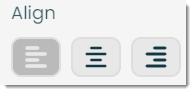
Align – Align is where you can control the alignment of the text.
Left: Align the text to the left side.
Center: Align the text in the center.
Right: Align the text to the right side.
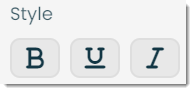
Style – This is where you can edit the style of the text. Style refers to the presentation of writing, tailored to suit the particular context, objective, or audience. These styles can be mixed and matched as you see fit.
Bold: This is bolded text.
Underline: This is underlined text.
Italicize: This is italicized text.
Frontline features of Report Builder
Posts – In Appward, a post is a comment that can be liked or replied to directly by other members of your organization. Posts are an effective way to communicate throughout the platform, especially when discussing the details of a report. To add a post, simply press the +Add post button at the top of the app screen while in the Posts tab.
Relations – You can include related records from other apps directly in the Relations tab. Simply click on the + icon and click on the record from any app that you wish to associate with the current Report Builder record. This is a helpful way of keeping information from different places in a centralized location.
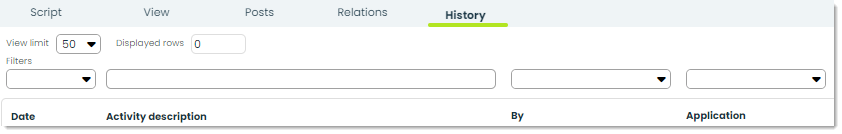
History – In History, you can view an activity log related to the Report Builder record you are viewing. You will see a list displaying the modifications date, activity description, modification author, and the application in which it was made. This helps you stay on track with what changes have been made to the record.